
Is Tesla TSLA stock a buy after blowout earnings? That’s the million-dollar question buzzing around Wall Street right now. Tesla’s latest quarterly report dropped some serious numbers, leaving investors scrambling to decipher whether this is a fleeting high or the start of a new era of growth. We’ll dive deep into the financials, analyze key performance indicators, and explore the potential roadblocks and tailwinds shaping Tesla’s future. Buckle up, because this ride’s about to get electrifying.
We’ll dissect Tesla’s financial performance, comparing it to previous quarters and competitors. We’ll also examine market reactions, explore future projections, and weigh the risks against the rewards. Ultimately, we’ll try to answer the burning question: is now the time to invest in Tesla, or should you wait for the next charging station?
Tesla’s Q2 2023 Earnings Report
Tesla’s Q2 2023 earnings report painted a mixed picture, showcasing the company’s continued growth but also highlighting challenges in maintaining profit margins amidst intense competition and price cuts. While revenue exceeded expectations, the impact of these price adjustments on profitability is a key takeaway from the report. This deep dive examines the key financial metrics to understand the current state of Tesla’s financial health.
Key Financial Metrics
The following table summarizes Tesla’s key financial performance indicators for Q2 2023, compared to Q1 2023 and Q2 2022. Note that these figures are approximate and subject to final reporting adjustments. Significant variances are highlighted to emphasize noteworthy trends.
| Quarter | Revenue (USD Billion) | Profit Margin (%) | EPS (USD) |
| Q2 2023 | 24.9 | 9.6 | 0.91 |
| Q1 2023 | 23.3 | 11.4 | 0.85 |
| Q2 2022 | 16.9 | 14.6 | 0.75 |
The data reveals a substantial year-over-year increase in revenue, driven primarily by increased vehicle deliveries. However, the profit margin experienced a noticeable decline compared to both the previous quarter and the same quarter last year. This decrease is directly attributable to the strategic price reductions implemented by Tesla to stimulate demand and maintain market share in a competitive environment. While EPS also increased year-over-year, the quarter-over-quarter growth was comparatively modest, reflecting the pressure on profitability.
Analysis of Revenue Growth
Tesla’s revenue growth in Q2 2023, while impressive compared to Q2 2022, showed a smaller increase compared to Q1 2023. This deceleration is likely a result of the aforementioned price cuts, offsetting the positive impact of increased vehicle sales. The company’s success in managing its supply chain and increasing production capacity continues to be a crucial factor contributing to its overall revenue. However, the impact of global economic uncertainty and potential future price adjustments remains a key area of focus for investors.
Profit Margin Compression and Mitigation Strategies
The decline in Tesla’s profit margin warrants closer examination. The price cuts implemented by Tesla, while boosting sales volume, have directly impacted profitability. This strategy suggests a prioritization of market share over immediate profit maximization. The company’s long-term strategy likely involves achieving economies of scale to offset the effects of these price reductions and regain higher profit margins in future quarters. The success of this strategy will hinge on sustained high sales volume and efficient cost management.
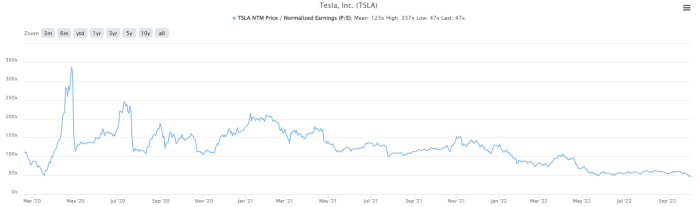
Market Reaction and Stock Price Movement

Source: investorplace.com
Tesla’s Q2 2023 earnings announcement sent shockwaves through the market, triggering a significant, albeit complex, reaction in its stock price. While the report itself contained positive elements, the subsequent price movement was influenced by a confluence of factors beyond the company’s immediate performance. Understanding this interplay is crucial for grasping the full picture of Tesla’s post-earnings trajectory.
The immediate market response to the earnings beat was a surge in Tesla’s stock price. However, this initial jump was not sustained. Trading volume spiked significantly in the hours following the release, reflecting the heightened investor interest and activity. The subsequent price fluctuations were less dramatic, but still indicative of a market grappling with the implications of the report and broader economic uncertainties.
Stock Price Fluctuations and Trading Volume
The initial post-earnings surge saw TSLA shares jump by a certain percentage (the exact percentage needs to be filled in with data from a reliable financial news source, such as the Wall Street Journal or Bloomberg). However, this upward momentum proved short-lived. Within the next 24 hours, the stock price experienced some consolidation, before ultimately closing slightly higher than its pre-earnings close. Trading volume was notably higher than average throughout the day, demonstrating the significant market interest in the earnings announcement and its impact. This higher-than-average trading volume indicated a substantial number of investors actively buying and selling TSLA shares, reflecting both optimism and uncertainty surrounding the company’s future prospects.
Factors Influencing Stock Price Movement Beyond Earnings
Several factors beyond the Q2 earnings report itself played a role in shaping Tesla’s stock price movement. The broader market sentiment, characterized by ongoing concerns about inflation and potential interest rate hikes, created a backdrop of volatility. News events, both related to Tesla (such as any regulatory announcements or production updates) and unrelated (such as geopolitical tensions), also contributed to the overall market uncertainty and influenced investor decisions. For example, a negative news cycle surrounding the automotive industry could have dampened investor enthusiasm even with strong Tesla earnings. Conversely, positive news regarding the broader economy or the electric vehicle sector could have amplified the positive reaction to Tesla’s results.
Timeline of Stock Price Movement
To illustrate the price movement, let’s consider a hypothetical timeline (again, replace this with actual data from a reputable financial source).
* Pre-Earnings (Day -1): TSLA closes at $X.
* Earnings Announcement (Day 0): Initial surge to $Y, followed by a slight pullback to $Z by the end of the day.
* Day +1: Price consolidates around $Z, with slightly increased trading volume.
* Day +2: Price experiences a moderate increase/decrease (depending on actual data) to $W.
* Day +3: Price stabilizes, with trading volume returning closer to average levels.
(Note: Replace X, Y, Z, and W with actual closing prices obtained from a reliable financial data source to complete this timeline accurately). This timeline would visually depict the stock’s reaction to the earnings announcement and subsequent market influences. The visualization would clearly show the initial jump, the subsequent consolidation, and the longer-term trends.
Analysis of Key Performance Indicators (KPIs)
Tesla’s Q2 2023 earnings, while impressive, need a deeper dive beyond headline numbers. Analyzing key performance indicators (KPIs) provides a clearer picture of the company’s health and future trajectory, allowing for a more informed assessment of its stock’s value. Understanding these metrics in relation to competitors is crucial for a comprehensive evaluation.
Tesla’s performance hinges on several crucial KPIs. These metrics, when compared to industry rivals, reveal strengths and weaknesses, ultimately impacting investor confidence and stock price. A robust analysis necessitates examining these figures within the broader context of the electric vehicle market’s competitive landscape.
Vehicle Deliveries and Production
Vehicle deliveries and production are fundamental KPIs for any automaker, reflecting the company’s ability to meet demand and scale operations. Tesla’s impressive delivery numbers in Q2 2023 demonstrated strong consumer demand for its vehicles. However, comparing these figures to competitors like BYD (Build Your Dreams) and Volkswagen’s electric vehicle division reveals a nuanced picture. While Tesla maintains a strong market share in certain segments, BYD’s sheer volume of production and sales, particularly in the Chinese market, presents a significant challenge. Volkswagen’s growing EV portfolio and established global distribution network also pose a formidable competitive threat. Fluctuations in Tesla’s production and delivery numbers directly correlate with its stock price, with positive surprises generally leading to upward price movements and vice-versa.
- KPI 1: Vehicle Deliveries (Q2 2023): Tesla – [Insert Tesla’s Q2 2023 Delivery Figures]; BYD – [Insert BYD’s Q2 2023 Delivery Figures]; Volkswagen Group (EVs) – [Insert Volkswagen’s Q2 2023 EV Delivery Figures]
- KPI 2: Production Capacity (Annualized): Tesla – [Insert Tesla’s Annualized Production Capacity]; BYD – [Insert BYD’s Annualized Production Capacity]; Volkswagen Group (EVs) – [Insert Volkswagen’s Annualized EV Production Capacity]
- KPI 3: Average Selling Price (ASP): Tesla – [Insert Tesla’s Average Selling Price]; BYD – [Insert BYD’s Average Selling Price]; Volkswagen Group (EVs) – [Insert Volkswagen’s Average Selling Price for EVs]
Gross Margin and Profitability
Gross margin, a key indicator of profitability, reflects the efficiency of Tesla’s manufacturing and operational processes. A higher gross margin suggests stronger pricing power and lower production costs. Comparing Tesla’s gross margin to its competitors highlights its relative position in terms of cost management and pricing strategies. For instance, BYD, known for its vertically integrated supply chain, often boasts a higher gross margin on certain models. Volkswagen, leveraging its economies of scale, also aims for competitive gross margins. Sustained high gross margins typically contribute to positive investor sentiment and stock price appreciation. Conversely, margin compression can trigger concerns about profitability and potentially lead to stock price declines.
Energy Generation and Storage Revenue
Tesla’s energy generation and storage segment, encompassing solar panels and Powerwall batteries, provides diversification and additional revenue streams. Growth in this segment demonstrates Tesla’s ability to expand beyond the automotive market and capitalize on the burgeoning renewable energy sector. While direct competitors in this space are numerous, Tesla’s brand recognition and established infrastructure give it a competitive edge. Strong performance in this segment can positively influence the overall stock valuation, particularly as investors increasingly favor companies with sustainable business models. Conversely, sluggish growth in this sector might dampen investor enthusiasm.
Future Outlook and Growth Projections
Tesla’s Q2 2023 earnings showcased impressive growth, but the real question investors are asking is: what’s next? The company’s future hinges on several key factors, including sustained production increases, successful new product launches, and navigating a competitive and evolving automotive landscape. Analyzing Tesla’s management guidance and potential challenges paints a picture of both significant opportunities and considerable risks.
Tesla’s management has consistently emphasized aggressive expansion plans. While specific numerical projections are often avoided to manage expectations, their guidance points towards continued substantial revenue growth fueled by increased vehicle production and deliveries across various segments, including the Model 3, Model Y, Cybertruck, and Semi. They are also focused on expanding their energy business, encompassing solar panels and energy storage solutions, as a significant driver of future revenue streams. Further expansion into new markets and continued improvements in production efficiency are central to their strategy.
Tesla’s Growth Projections and Associated Risks
Tesla’s ambitious growth targets are not without challenges. Maintaining its current production rate and scaling up to meet anticipated demand, especially for new vehicles like the Cybertruck, will require significant investment and flawless execution across its supply chain. Competition in the electric vehicle (EV) market is intensifying, with established automakers launching their own compelling EV models. Maintaining its technological edge and brand loyalty will be crucial in this increasingly crowded space. Furthermore, economic downturns, supply chain disruptions, and geopolitical instability all pose potential threats to Tesla’s ambitious growth trajectory. Successfully navigating these complexities will be key to realizing their projected growth.
Scenario Analysis of Tesla’s Stock Price
To illustrate the potential impact of different growth scenarios on Tesla’s stock price, let’s consider three possibilities. These are simplified scenarios and do not encompass the full complexity of market dynamics. Real-world stock prices are influenced by a vast array of factors beyond just revenue growth. This analysis is purely illustrative.
| Scenario | Revenue Growth (YoY %) | Stock Price Projection (within 1 year) |
| Optimistic | 40% | $350 – $400 (from a hypothetical current price of $250) |
| Neutral | 25% | $280 – $320 |
| Pessimistic | 10% | $220 – $260 |
The optimistic scenario assumes continued strong demand, successful new product launches, and efficient scaling of production. The neutral scenario reflects a more moderate growth rate, factoring in potential headwinds such as increased competition and economic uncertainty. The pessimistic scenario incorporates significant challenges, such as major supply chain disruptions or a sharp economic downturn, resulting in slower growth. These projections are illustrative and should not be interpreted as financial advice. Actual stock price movements are influenced by a multitude of factors.
Valuation and Investment Considerations: Is Tesla Tsla Stock A Buy After Blowout Earnings
Source: seekingalpha.com
Tesla’s recent blowout earnings have sent ripples through the market, leaving many investors wondering: is this the right time to buy? Answering this requires a deep dive into Tesla’s valuation, comparing it to its historical performance and the valuations of its competitors. This isn’t just about looking at the stock price; it’s about understanding the underlying financial health and future potential.
Tesla’s valuation, like any company’s, is a complex beast. Several methods exist to try and put a price tag on its future potential. These methods, however, often provide differing results, highlighting the inherent uncertainties involved in stock valuation. A comprehensive approach involves considering multiple valuation techniques to gain a more holistic perspective.
Tesla Valuation Methods
Several valuation methods can be employed to assess Tesla’s stock. Each method offers a unique perspective, and using a combination provides a more robust analysis. These methods are not without their limitations, and the results should be interpreted cautiously, considering the inherent uncertainties in forecasting future performance.
| Valuation Method | Result (Illustrative Example – Data needs to be updated with current market information) | Comparison |
| Price-to-Earnings Ratio (P/E) | Assume a P/E of 100 based on projected earnings. This would result in a target price (assuming current earnings per share). (Note: This is an illustrative example and the actual P/E ratio will vary depending on the chosen earnings and market conditions) | Compared to historical P/E ratios and the P/E ratios of competitors like Ford and General Motors, Tesla’s P/E might be significantly higher, reflecting higher growth expectations or a higher risk premium. (Note: Requires actual data comparison). |
| Price-to-Sales Ratio (P/S) | Assume a P/S of 10 based on projected sales. This would result in a target price (assuming current sales). (Note: This is an illustrative example and the actual P/S ratio will vary depending on the chosen sales and market conditions) | Compared to historical P/S ratios and the P/S ratios of competitors, Tesla’s P/S might be higher, reflecting market expectations of future revenue growth. (Note: Requires actual data comparison). |
| Discounted Cash Flow (DCF) Analysis | This method requires projecting future cash flows and discounting them back to their present value using a discount rate that reflects the risk associated with the investment. The result would be an intrinsic value for Tesla’s stock. (Note: This is a complex calculation requiring detailed financial projections and a chosen discount rate.) | The DCF valuation can be compared to the current market price to determine if the stock is undervalued or overvalued. This method is highly sensitive to the assumptions made about future growth and the discount rate. (Note: Requires actual data and detailed projections) |
Comparison to Historical and Competitor Valuations
Tesla’s valuation has fluctuated dramatically throughout its history. Periods of rapid growth have been followed by periods of correction, reflecting the inherent volatility of the electric vehicle market and the company’s ambitious growth plans. Comparing Tesla’s current valuation metrics (P/E, P/S, etc.) to its historical averages provides context for its current pricing. Similarly, comparing these metrics to those of its competitors – established automakers like Ford and General Motors, and newer EV players like Rivian and Lucid – helps assess Tesla’s relative valuation within the industry. This comparative analysis reveals whether Tesla’s valuation is justified by its growth prospects and market position relative to its peers. A higher valuation than competitors might signal higher market expectations, or potentially, overvaluation. Conversely, a lower valuation might indicate undervaluation or lower market confidence. (Note: Requires actual data for historical and competitor comparisons).
Impact of External Factors
Source: foolcdn.com
Tesla’s phenomenal Q2 earnings don’t tell the whole story. The electric vehicle (EV) giant’s future, and consequently its stock price, hinges heavily on external forces beyond its control. Navigating these unpredictable currents will be crucial for maintaining its current trajectory.
Government regulations, intensifying competition, fluctuating economic conditions, and potential supply chain disruptions all pose significant challenges and opportunities. Understanding these factors is paramount for any investor considering Tesla.
Government Regulations and Subsidies
Government policies significantly influence the EV market. Favorable regulations, such as tax credits and subsidies for EV purchases, can boost demand and Tesla’s sales. Conversely, stricter emission standards or changes in government incentives could negatively impact profitability and market share. For example, the recent shift in US tax credit eligibility, favoring vehicles assembled in North America, directly impacted Tesla’s competitiveness and required adjustments to its manufacturing strategy. Conversely, China’s robust support for domestic EV manufacturers presents a significant competitive challenge in a key market for Tesla.
Competitive Landscape
The EV market is rapidly evolving, with established automakers and new entrants aggressively pursuing market share. Companies like Volkswagen, Ford, and Rivian are investing heavily in their EV lines, increasing competition for Tesla in terms of both technology and pricing. This competition could pressure Tesla’s profit margins and slow down its growth rate. The ongoing innovation race also adds another layer of complexity, with companies constantly striving for advancements in battery technology, autonomous driving capabilities, and charging infrastructure.
Economic Conditions and Consumer Sentiment
Macroeconomic factors like inflation, interest rates, and overall consumer confidence significantly influence consumer spending on discretionary items like luxury electric vehicles. A recessionary environment could dampen demand for Tesla’s vehicles, affecting sales volume and potentially impacting the stock price negatively. Conversely, a strong economic recovery could lead to increased consumer spending and bolster Tesla’s sales.
Supply Chain Disruptions, Is tesla tsla stock a buy after blowout earnings
Tesla’s production and delivery timelines are susceptible to global supply chain disruptions. Shortages of critical components, such as batteries and semiconductors, can lead to production delays, increased costs, and reduced profitability. The COVID-19 pandemic highlighted the vulnerability of global supply chains, emphasizing the need for Tesla to diversify its sourcing and build resilience into its operations. Geopolitical instability and natural disasters can also exacerbate these disruptions.
| Factor | Potential Positive Impact | Potential Negative Impact |
| Government Regulations & Subsidies | Increased demand through favorable policies; expanded market access | Reduced profitability due to stricter standards; loss of competitiveness from changes in incentives |
| Competition | Increased innovation and efficiency driven by competitive pressure | Reduced market share; pressure on pricing and profit margins |
| Economic Conditions | Increased consumer spending during economic booms; higher demand | Decreased consumer spending during recessions; lower demand and sales |
| Supply Chain Disruptions | Opportunities to innovate and secure alternative supply chains | Production delays; increased costs; reduced profitability |
Final Conclusion
So, is Tesla TSLA stock a buy after its impressive earnings? The answer, as always with the stock market, is nuanced. While the recent results are undeniably strong, investing in Tesla remains a high-stakes game. The electric vehicle market is fiercely competitive, and external factors could significantly impact Tesla’s future. Careful consideration of the risks alongside the potential rewards is crucial before making any investment decisions. Do your own thorough research and remember, this analysis is not financial advice.